Nano Banana 2.1: read the model card alongside the images
Google DeepMind documents image generation, editing results, and known limitations.
Nano Banana official model symbol. Credit: Google DeepMind · official model symbol. Original image ↗
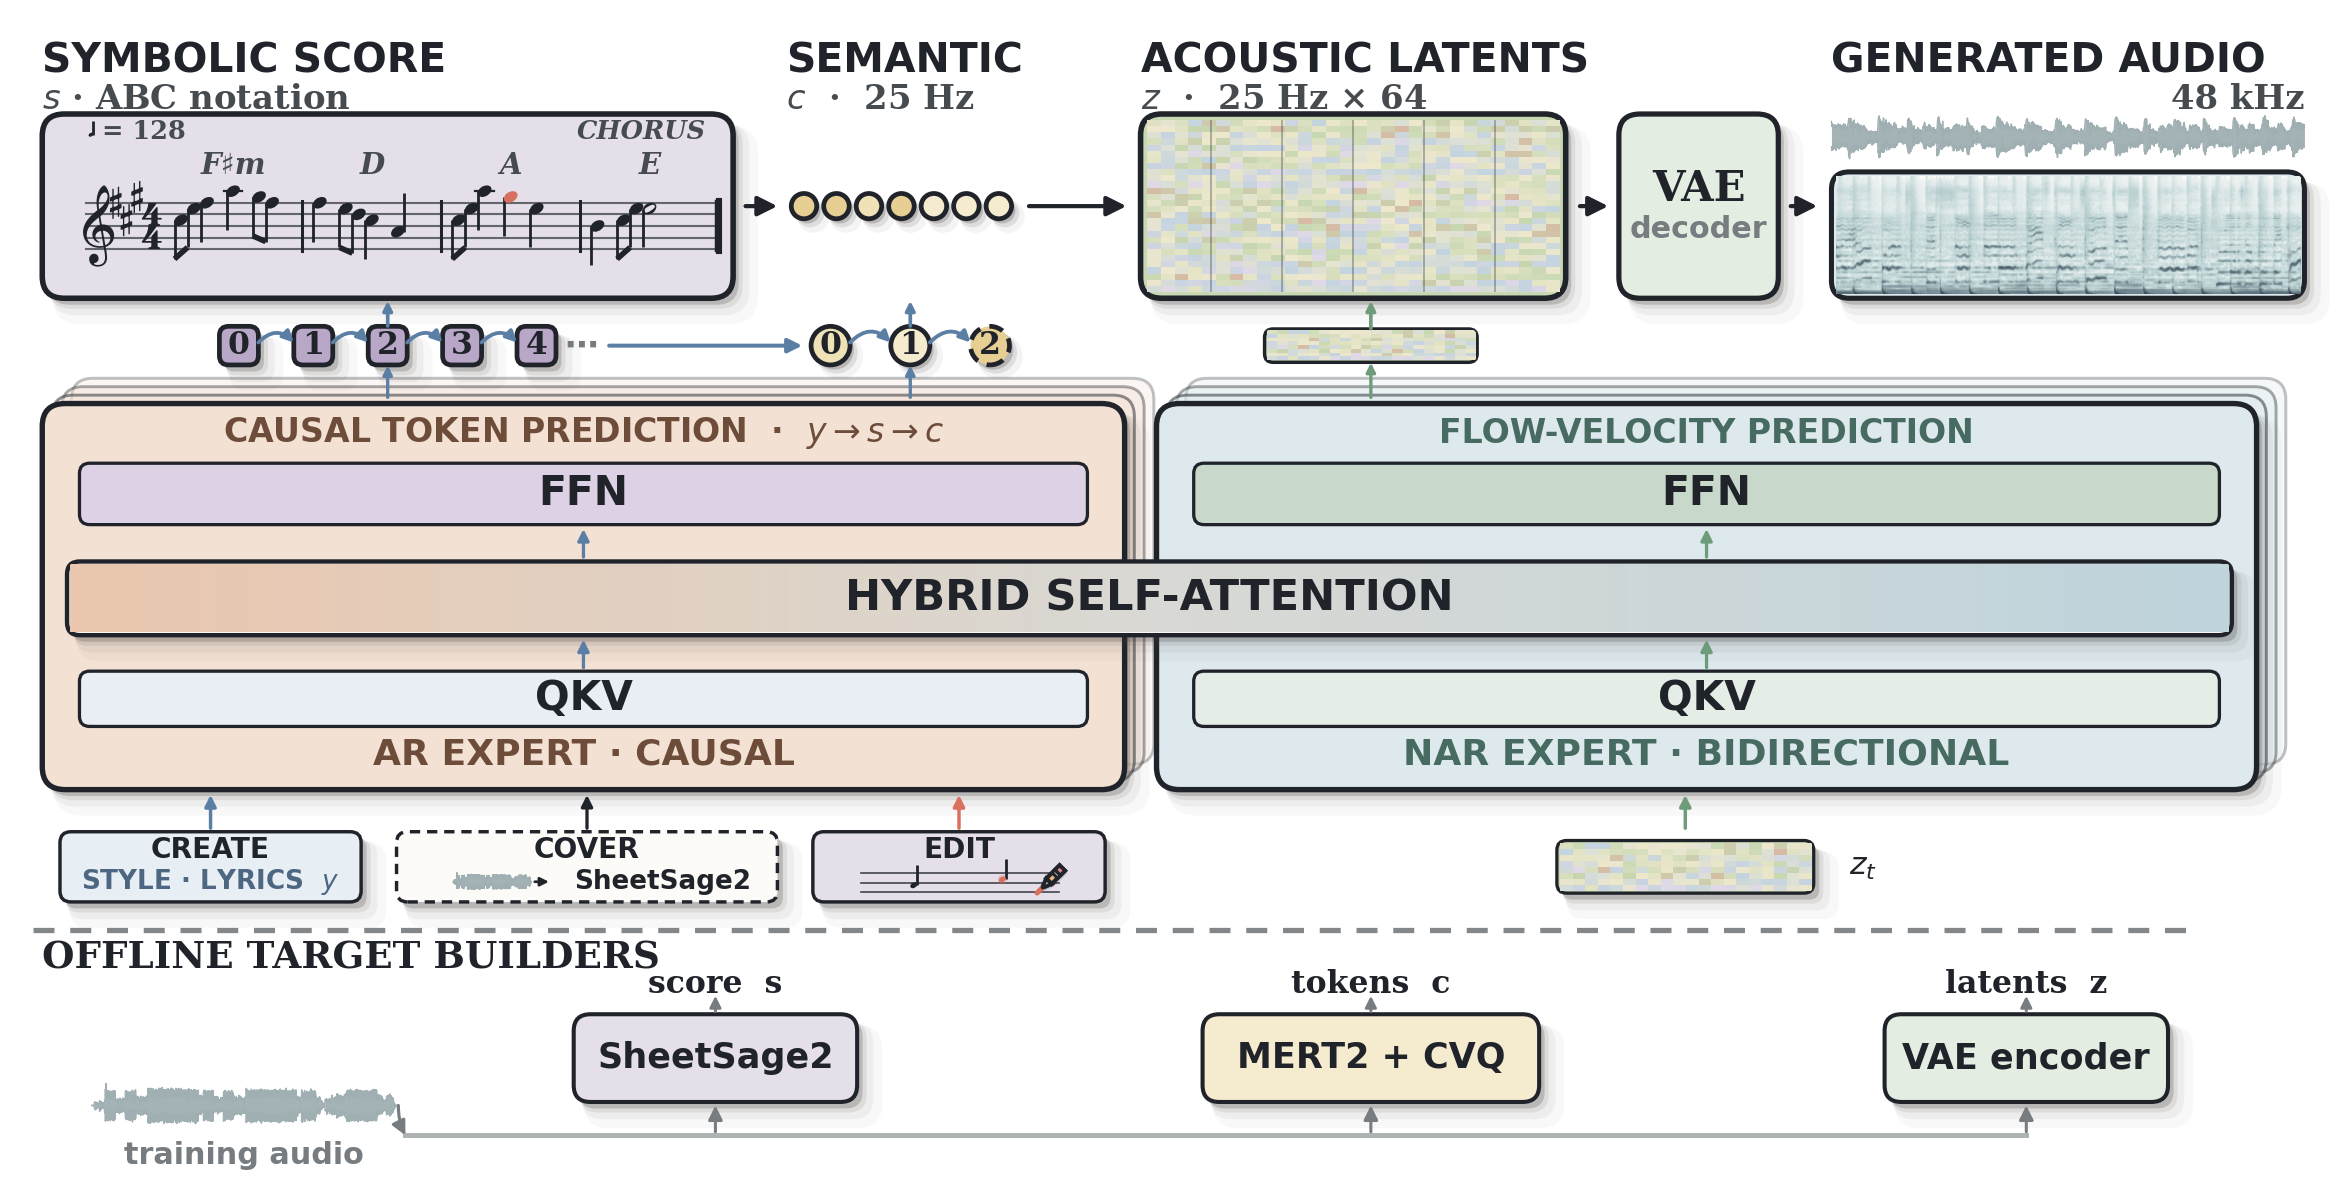
Google DeepMind’s Nano Banana 2.1 model card describes a text-and-image model based on Gemini 3.6 Flash. It accepts text and image inputs and produces images and text.
Turn an editing brief into checks you can repeat
Suppose you need a product image with a new background. The useful question is not only whether the result looks attractive. The product’s shape, logo, color, and required details should remain consistent while the background changes.
Write the invariants before generating: what may change, what must remain fixed, and which supplied reference defines the result. Keep the original beside every output. For a diagram or infographic, list the facts and labels that must appear so that factual errors do not hide behind good typography.
What the evaluation covers
The card reports text-to-image and editing evaluations, including infographic design, factuality, character consistency, product consistency, stylization, and multi-reference editing. It separates thinking and non-thinking configurations.
Those distinctions matter when comparing results. A single headline score does not describe every task or generation setting.
Use the card as a boundary
Model cards explain dependencies, intended usage, evaluations, and limitations. They are a better basis for a technical description than an isolated example image or a copied product slogan.
For the current access path, consult the official product and developer resources linked from the card. Do not infer an API identifier or pricing from the public model name alone.
Match the evaluation to the configuration
The model card separates tasks and generation settings. Preserve those settings when interpreting a score. A result for one editing category or thinking configuration does not establish the same outcome for every image task.
Run a small set of briefs more than once. Include one crowded composition, one text-heavy example, and one edit where identity must be preserved. Record whether a failure is factual, visual, or an instruction-following problem. That makes a comparison useful to the person who will approve the final images.
Work through the cost of choosing the best output
Image comparisons can change meaning when one system gets more attempts. Suppose, only for an illustrative calculation, each independent output has probability p = 0.6 of meeting a predefined requirement. The chance that at least one of n attempts meets it is:
At one attempt this is 60%. At three it is 93.6%, and at five it is 98.976%. The graph holds the invented single-attempt probability fixed while changing the candidate budget. These are not Nano Banana success rates. Real outputs may have correlated failures, and the independence assumption may be unrealistic for repeated versions of the same brief.
The calculation explains why a best-of-five gallery and a one-attempt evaluation answer different questions. Selecting a pleasing output consumes extra attempts and can hide how often the model fails. Report the candidate budget, selection rule, and rejected outputs when making a practical comparison. Do not use the toy curve to forecast the service's actual reliability.
Give factual and visual checks separate columns
For an infographic, verify the facts and labels before judging style. For a product edit, compare the product against the original reference. For a recurring character, inspect the details that define identity across outputs. A result may look professional while using the wrong number, omitting a required detail, or changing a logo. Combining those checks into one aesthetic score conceals the reason a user would reject the image.
An illustrative acceptance sheet could include requested change, preserved shape, exact text, factual content, and visible artifacts. Define which checks are mandatory rather than averaging a serious factual error away with a good composition. Retain the generation configuration and reference set so another reviewer knows what information the model received.
Thinking and non-thinking settings should also remain explicit. A score from one setting is not evidence for another, and an access path may expose only certain configurations. The model card provides evaluation context; the product or developer documentation defines the available workflow. Read them together before selecting a setup, and distinguish what the publisher measured from what your own controlled image set establishes.
Candidate budgets change what a selected sample can show
Focus the graph and use arrow keys, or tap a point, to inspect values. The complete data table is available below.
View data table
| Independent attempts | At least one success (%) |
|---|---|
| 1 | 60 |
| 2 | 84 |
| 3 | 93.6 |
| 4 | 97.44 |
| 5 | 98.976 |
Confirm the current access path
Use the product and developer destinations linked from the official material to identify the supported workflow. Do not guess an API model identifier, a price, or a quota from the marketing name. The model card describes the model and its evaluation boundaries; the service documentation describes how a particular product exposes it.
The cover here is the official model symbol, not an output from our own generation test. We have reviewed the published card rather than independently benchmarked the model. For production artwork, review the source references and the final output at the size and medium where it will actually be used.